The two data sets are lego_sample and lego_population. These data set are available on openintro.org/data and will soon be added to the `openintro` R package.
The data set(s) of the week are lego_sample and lego_population. Earlier this term, I was looking for a different data set to use in regression. I wanted to do something other than to predict house prices based on lot size and square footage. So, I decided to do a quick search for "multiple linear regression" at the Journal of Statistics and Data Science Education. I was thrilled to find an article by Anna Peterson and Laura Ziegler. Their article Building a Multiple Linear Regression Model with LEGO Brick Data discusses a great activity to predict Amazon sale price based on the number of pieces in the set but also based on the type of set (City, Friends) or size of the block (small, large). When I used this activity and data set in class, I found that the data set was straightforward to use, and students grasped the different variables very quickly. Before the activity, I showed a few web pages from the Lego website to ensure that everyone started the activity with some knowledge about the types of sets available; however, most students were familiar with the Lego brand. One of the reasons I liked the activity so much is that it illustrates the investigative process. GAISE 2016 includes two emphases. The first is "Teach Statistics as an investigative process of problem-solving and decision making," which can be easily identified in the activity. The question appears at the top of the page, and the students work towards the answer through carefully crafted questions. The students finish each part by answering that research question. I found in my teaching that it is imperative to be very intentional about answering the research question. It is not enough to assume that students will make the connection.
Another part of the activity that I liked was the focus on conceptual understanding before getting into coding. The students in my class used JMP, but you can also use an R shiny app to complete the activity. The graphics built during the activity helped the students grasp the differences between adding an indicator versus adding an interaction term. The follow-up to this activity would be to understand the coding required to build these models in R. Thus, having data in the Open Intro package would help facilitate this next day of class activity.
I asked the authors, Anna Peterson and Laura Ziegler, to comment on two questions.
- What is your favorite part of this activity?
Response: "My favorite part is when we ask students to create a single model to predict price using the number of pieces and an indicator variable for Lego City and Friends. Students really struggle considering they have to think about multiple new concepts at the same time: coding, conditional statements, and how to incorporate more than one explanatory variable in a model. Seeing students faces switch from being a look of concern to a look of understanding is great."
- What part of the learning activity really resonates with the students?
Response: "Students really enjoy the context of Lego. When it comes to the statistical content, I think students really resonate with the last questions about the interaction model in the activity. They have to work very hard to get to the end and feel accomplished when they finish. This semester, towards the end of the activity, I overheard a student say 'Whoa, I did not expect that to happen' when they realized that the estimated regression model with the interaction term simplifies to two separate estimated simple linear regression models."
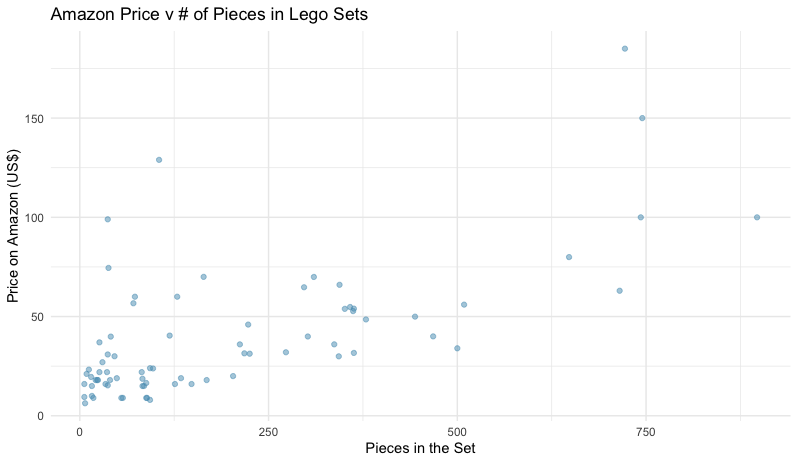
Here is the first plot of the activity (so I don't give away the ending). Their first research question was "Is there a relationship between the Amazon price versus the number of pieces per set for LEGO City and LEGO Friends sets in our sample?
This graphic allows students to reacquaint themselves with the fundamental topics of simple linear regression before adding another predictor variable. As for the other plots and research questions, I encourage you to look at the journal article by Anna Peterson and Laura Ziegler.