
The data set is acs12. This data set is available on openintro.org/data and in the `openintro` R package.
This week's data set of the week is `acs12`. This data set is from the American Community Survey. The data set includes thirteen variables including income, employment, hours worked, race, age, gender, a citizen of the US, the time it takes to get to work, first language, married, level of education, disability, and which quarter of the year the participant was born. There are 2000 respondents.
I have found that students are very curious and concerned about their future careers. They want to know how many hours they are going to have to work per week or how much money will they make? The acs12 data set allows students to explore income and hours worked for a week.
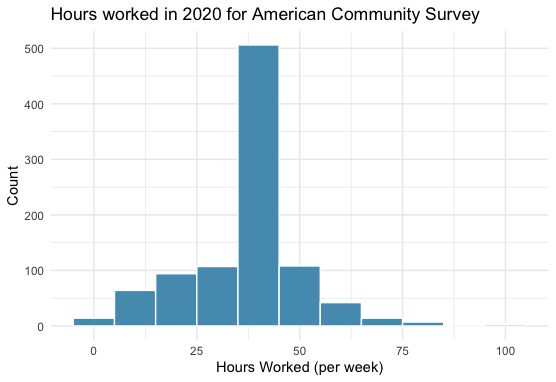
From a pedagogical standpoint, it also can have the students very carefully consider the population of interest. Let’s start to explore hours worked per week. For example, most people expect a 40-hour workweek. Is that realistic? Here is a histogram of the hours worked per week from the acs12 data set.
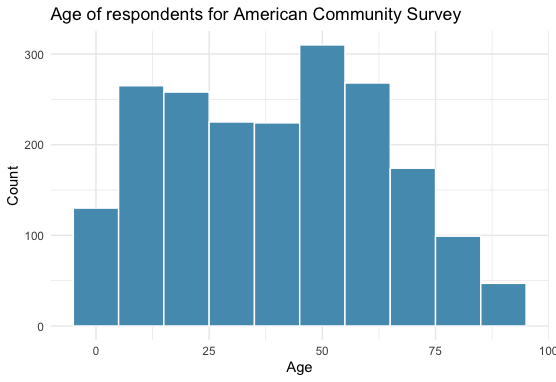
However, if we investigate the sample a little further, we see that it includes children and those likely to be retired.
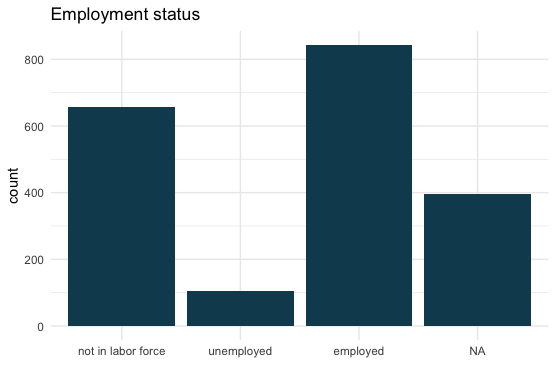
We also included those who were not employed or who don't have information as shown in the below bar graph.
To get a better representation of people who would be working, we should restrict the data set to only those that reported that they were employed. Using only those employed, we can get a 95% confidence interval for the population mean, (38.06, 39.80).
After finding this confidence interval, I would ask the following questions:
- What is the population in this problem?
- Can we use this interval to estimate the current time that employed Americans spend working? Explain.
- Is the population mean statistically different from 40? Practically different?
Source: Results from the US Census American Community Survey, 2012..