
The data set is dream. This data set is available on openintro.org/data and in the `openintro` R package.
This week's data set of the week is dream. This data set is from the SurveyUSA news poll. The survey consisted of 11 questions, but the data set only has the responses to two questions. The stance variable shows if the respondent about the dream act they support, do not support, or are not sure. It also asked the participants if they were conservative, moderate, or liberal. The poll had the results of 910 respondents.
Although some students might be aware of the DREAM Act, other students might not. I encourage you to either explain the act or have students look it up. Wikipedia has a good explanation. You may also want to clarify that the DREAM Act is a bill that Congress has not passed. This bill is not the same as the DACA executive order. President Obama first created the executive order; then, it was repealed by President Trump and then reinstated by President Biden. You can find more of a description of the difference at the FileRight blog.
The data set is another excellent one to use for essential graphical summaries at the start of the semester. One way to present this to the class is to have the students answer the following two questions.
- What type of variables are stance and ideology?
- What types of graphs could we use to explore the relationship between stance on the Dream Act and ideology?
You can then have them work in groups or pairs to make the graphs. Students can start to explore this relationship by creating a bar chart.
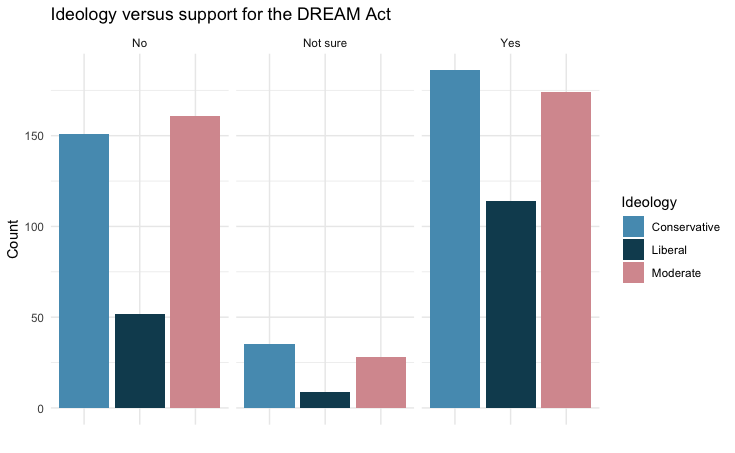
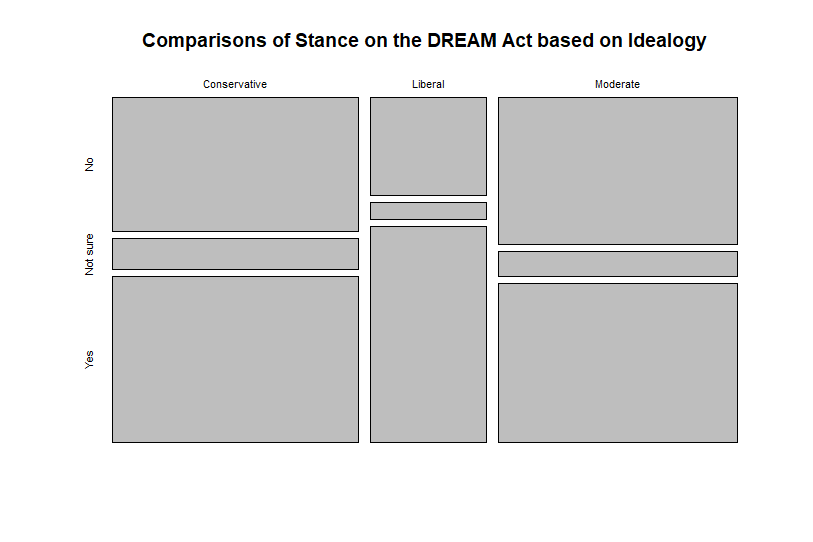
The bar chart above doesn’t help us to make comparisons very easily when there is a difference in the sizes of each group. Another way to visualize the data is to create a mosaic plot. A mosaic plot allows you to compare the groups while also visualizing the size of each group.
To extend this assignment, you might ask students to find a more recent poll about the opinions about DACA and the proposed DREAM Act.
Source: SurveyUSA, News Poll #18927, data collected Jan 27-29, 2012.