
Like many folks teaching introductory statistics, I've tried many software packages hoping to find the balance of features and usability that works best for me and my students. There are benefits to using tools from R to excel, and everything in between. For the fall of 2021, I was interested in trying jamovi, which is something of an SPSS stand-in. While it doesn't have all the features of something like SPSS built in, there are add-on modules which extend the abilies, though very little is needed for an introductory statistics course. Related to jamovi is JASP, which shares a great deal of code base and style, so I'll talk a little about both of them here.
I've liked using the OpenIntro labs in the past, so I wanted to translate those labs into jamovi for the semester, and ended up creating JASP versions at the same time, which are available on the OpenIntro Statistics textbook page. I started with the tidyverse versions of the labs as a base, and made changes as necessary to fit the features of the software package. In this post, I wanted to talk a little about why these tools ended up working well for my needs, in hopes that they might be useful to others who want to try them out. After that, I'll describe some of the reasons you might want to use one piece of software vs the other. I've included screenshots from jamovi, but JASP looks very similar, and I'd recommend trying both out for a little while to see if one fits your needs better.
Reasons to Use Either
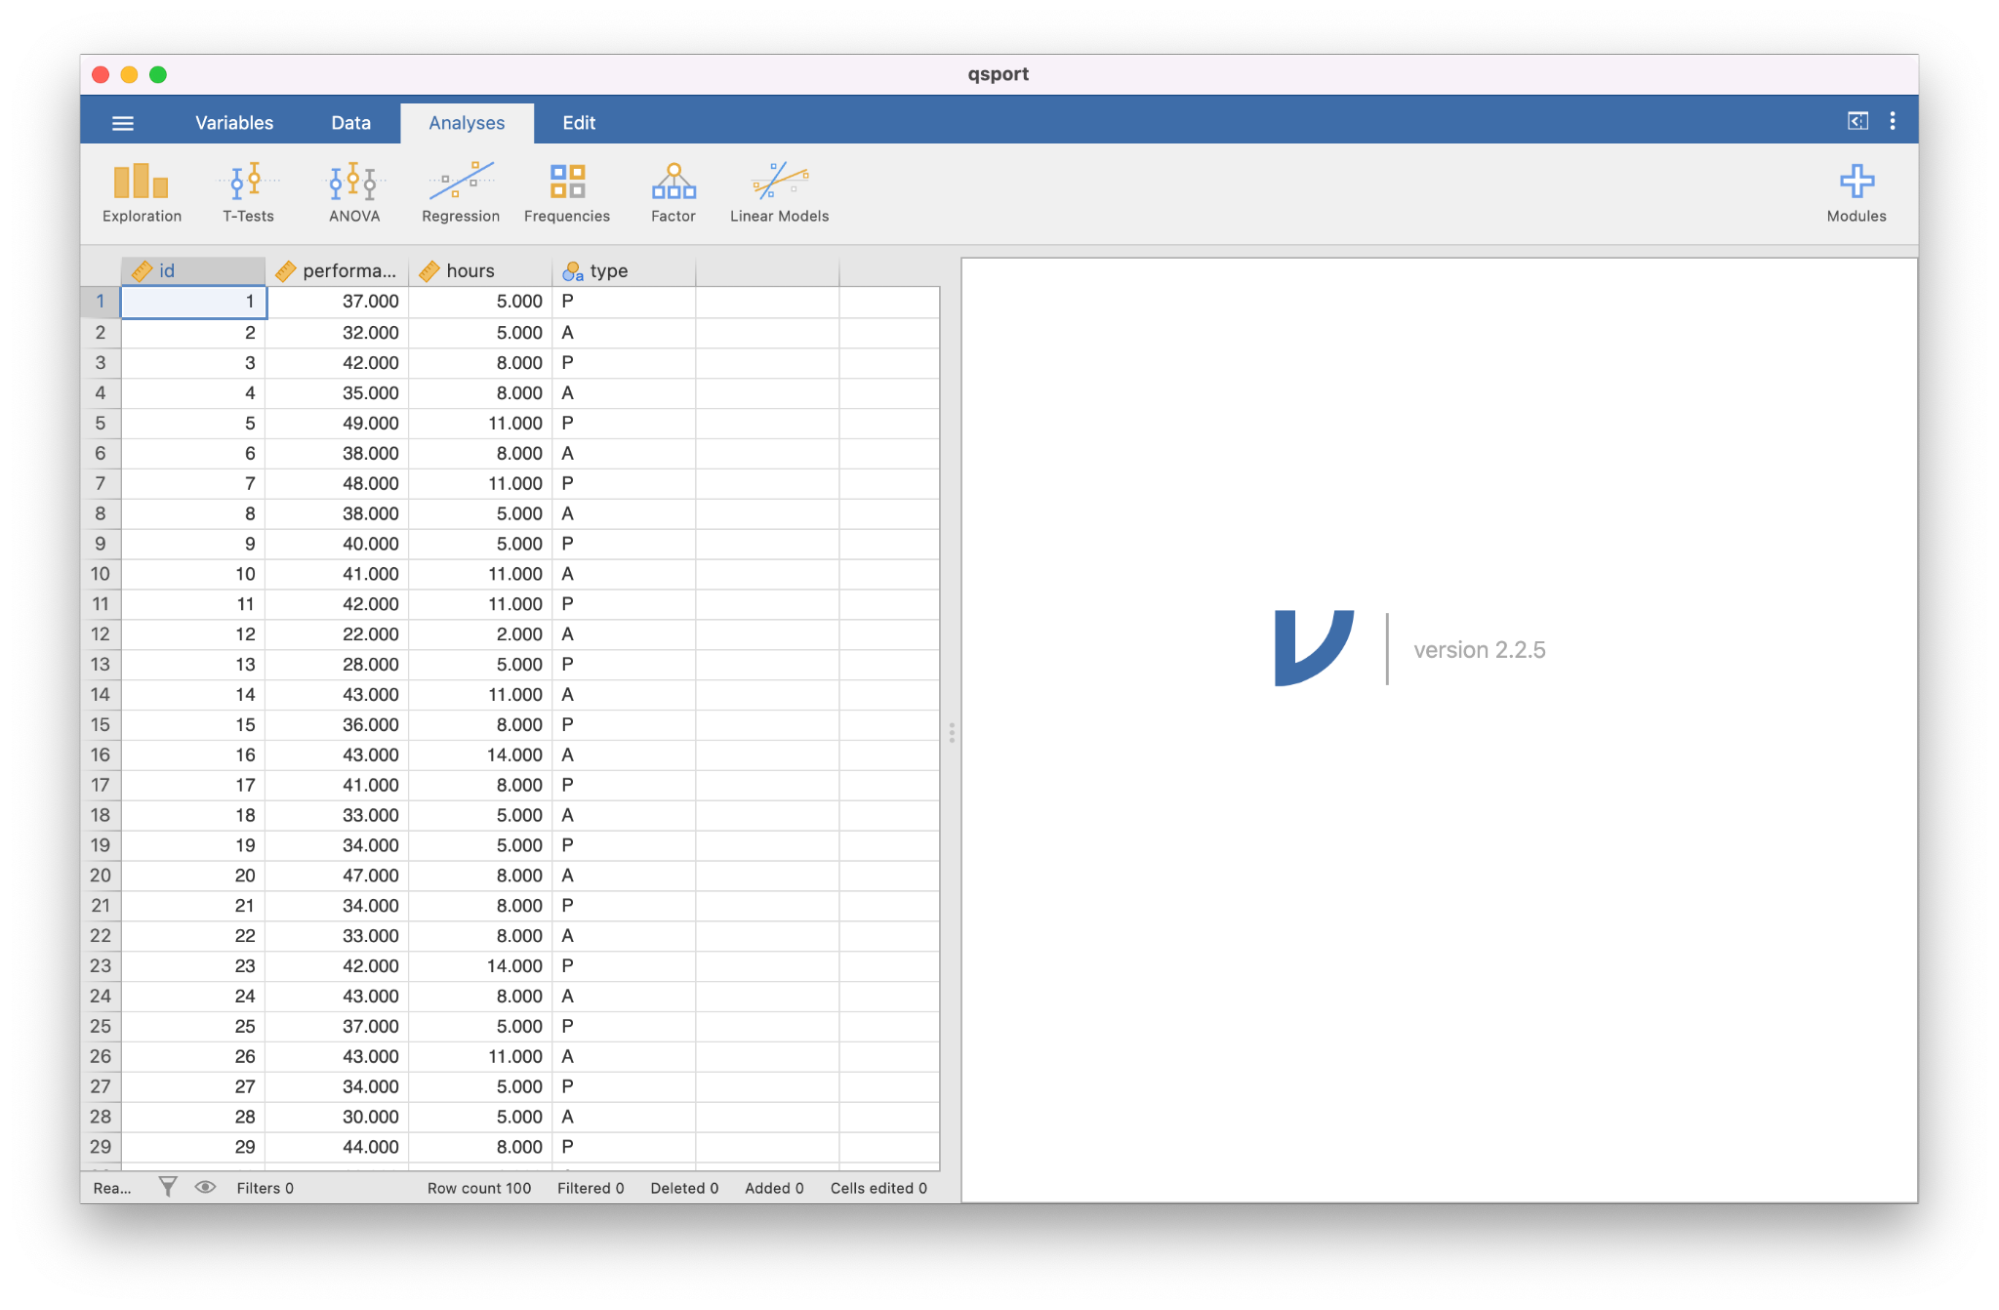
Both jamovi and JASP follow a method for doing data analysis which I found to be very useful for teaching and thinking about statistics. One can easily load a dataset (I typically started with a csv file), and get a preview of the data.
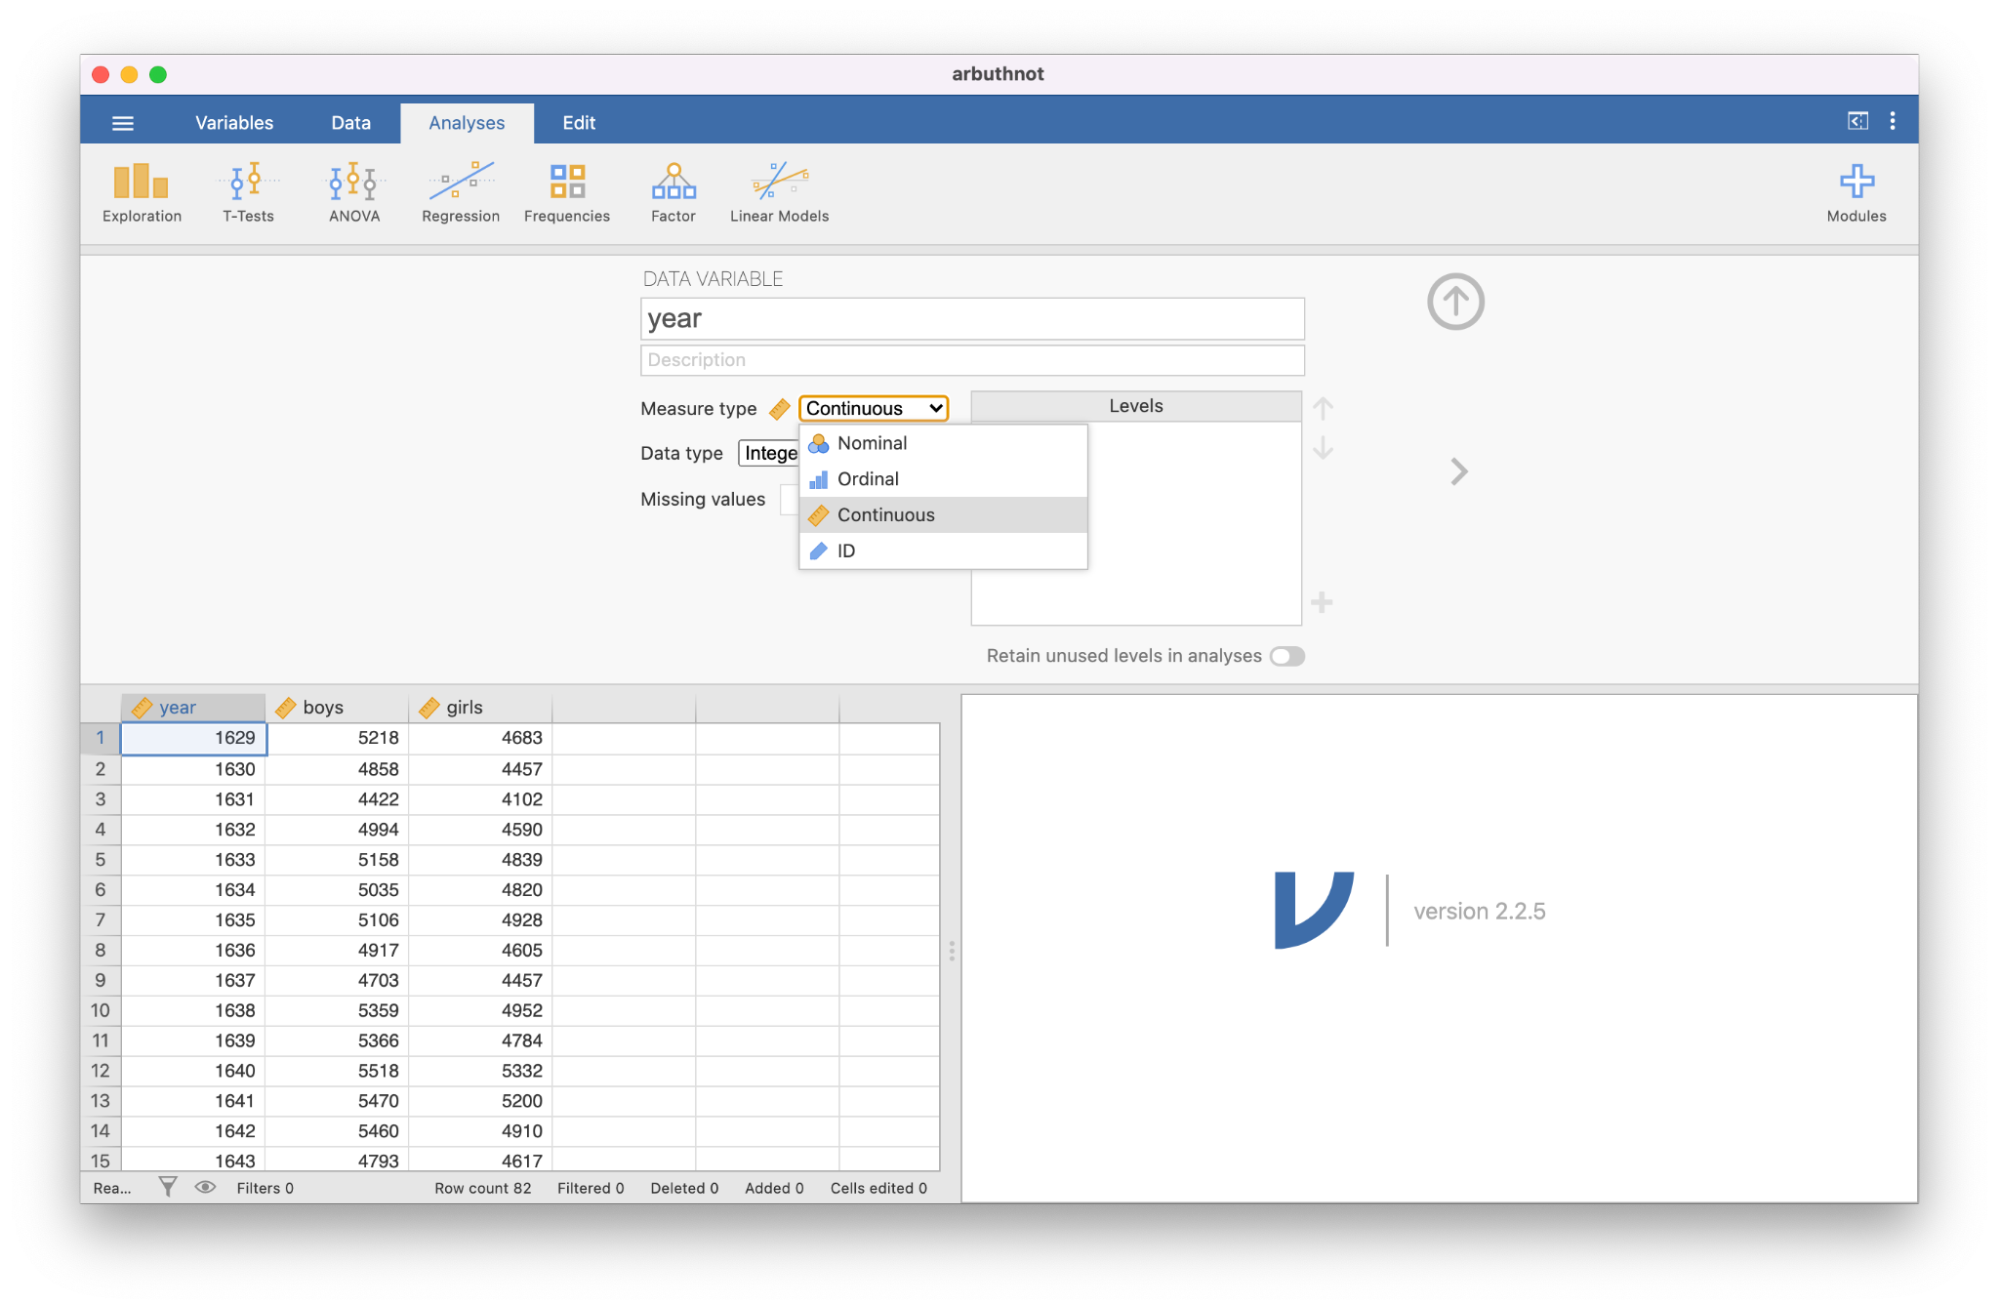
Each variable can be specified by its type (numeric, nominal, etc.), and one can easily change the name of the variable or relabel levels using the menus. This was nice to be able to get into the analysis quickly.
Once the data is ready to analyze, there are various options for analysis in the menu bar. Menus allow you to drag variables to appropriate columns. Clicking through these menus leads to some output, which shows up in the right hand side.
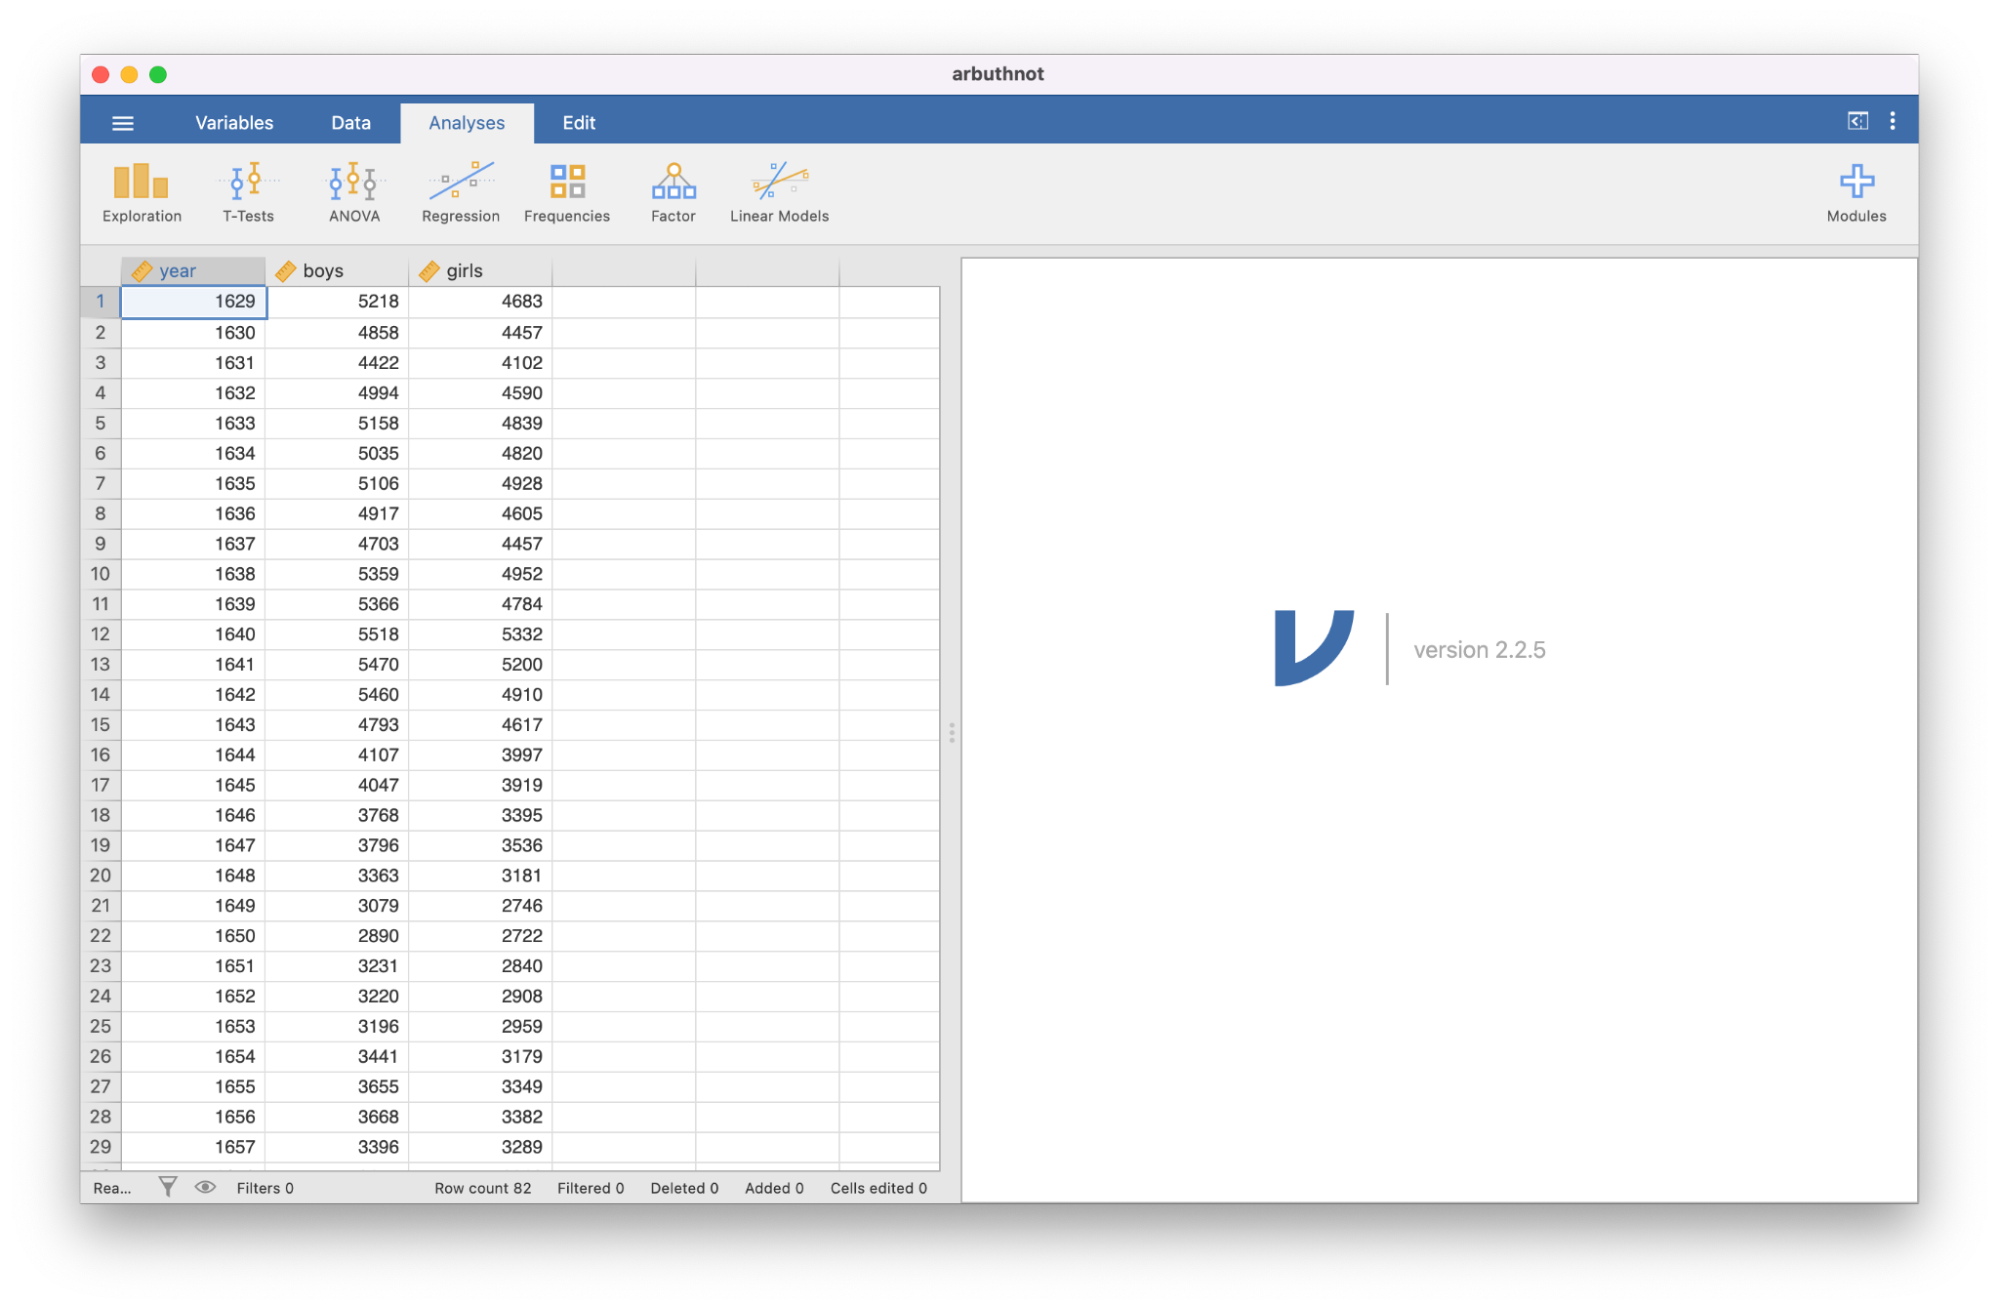
As an instructor, one of the reasons I really liked this setup is that it followed a lot of the reproducible research principles I taught when using R in the classroom. Any analysis can be revisited by clicking on an analysis and the appropriate menu will pop back up. For example, you might load a dataset:
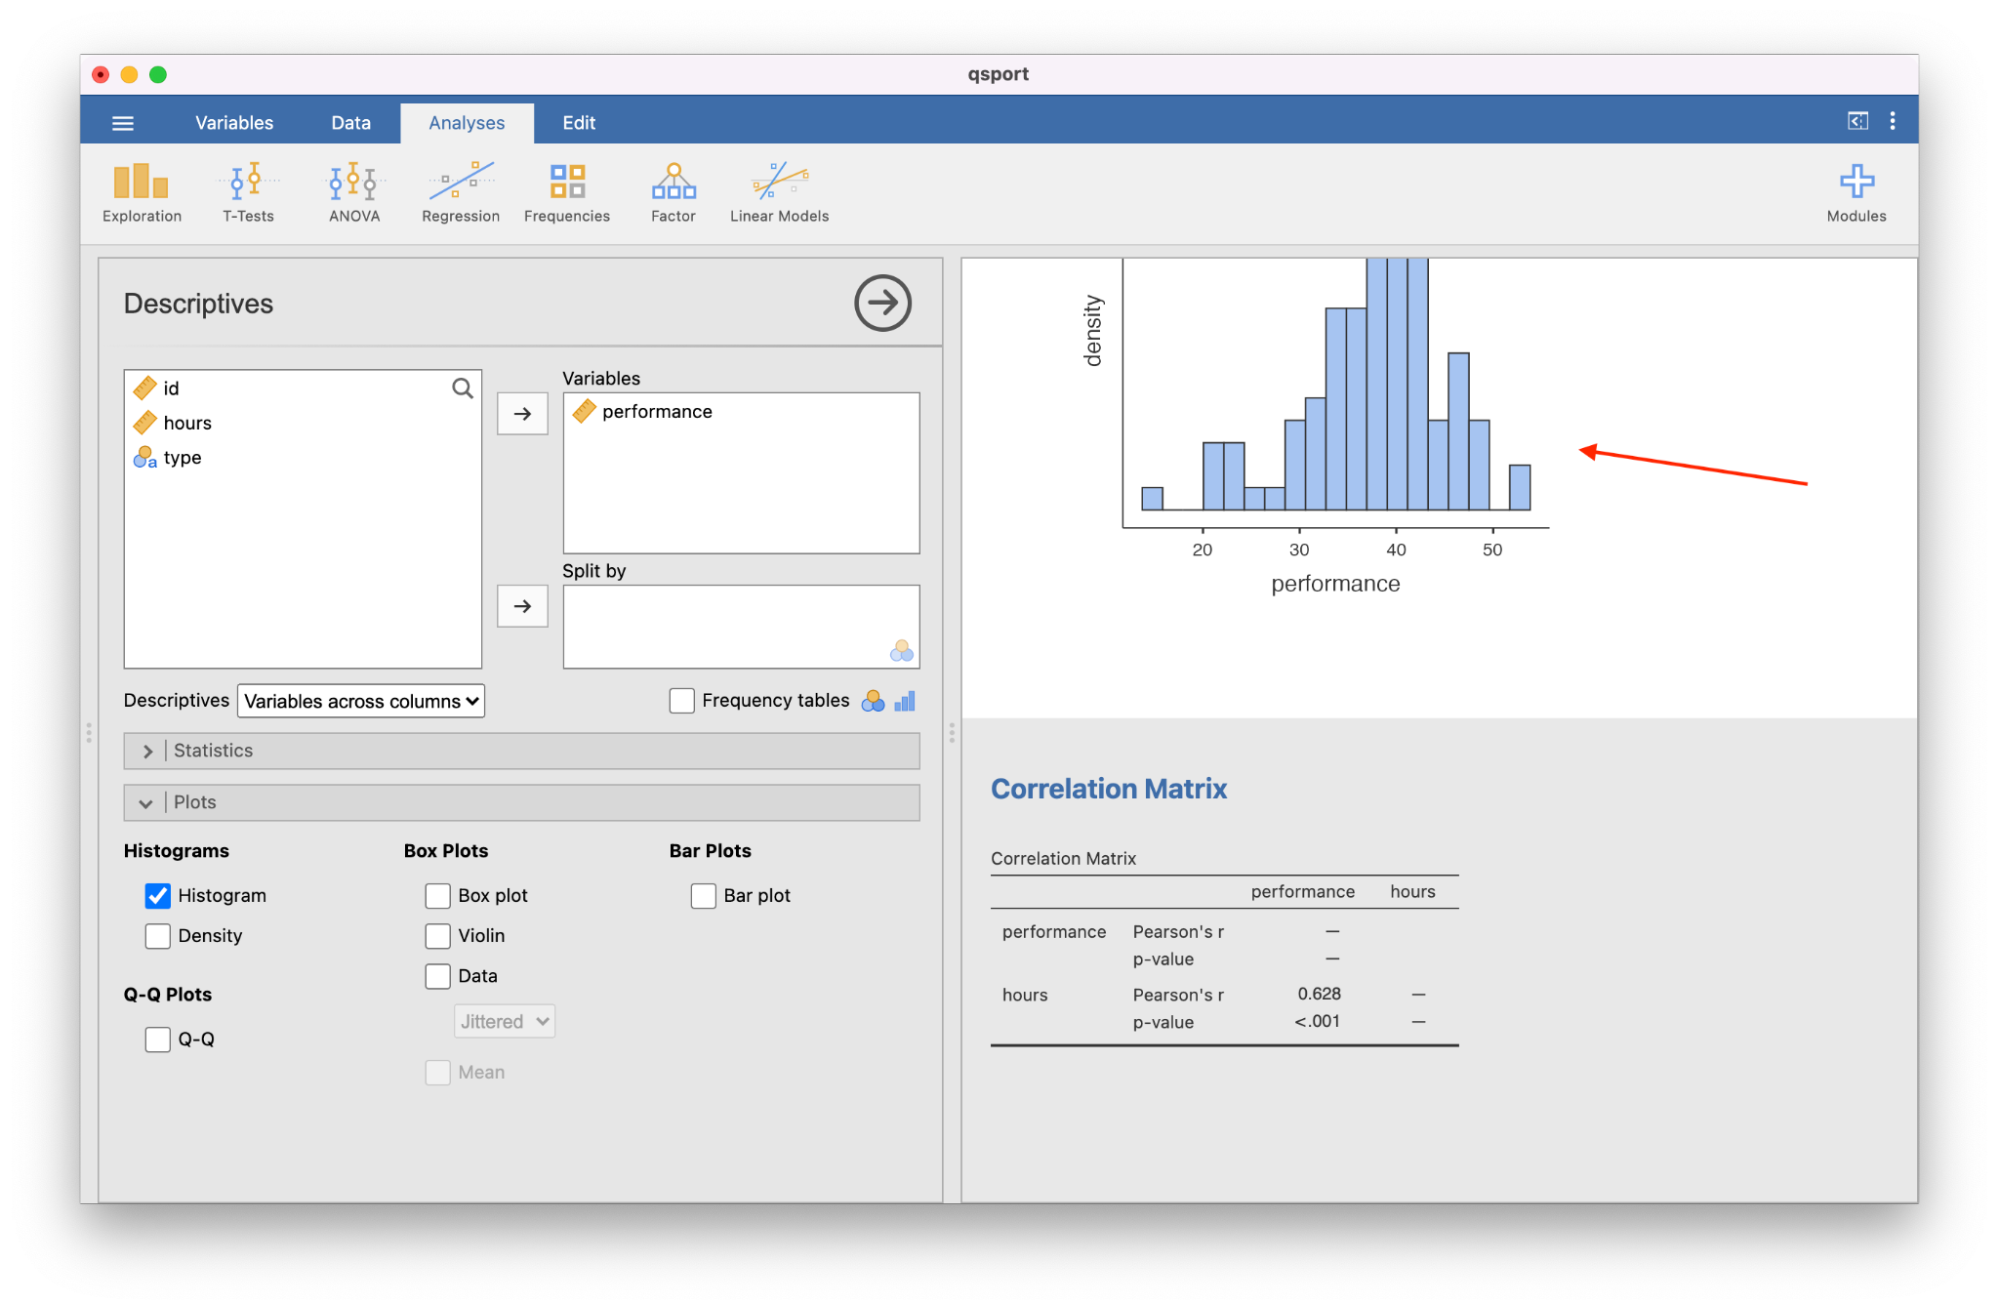
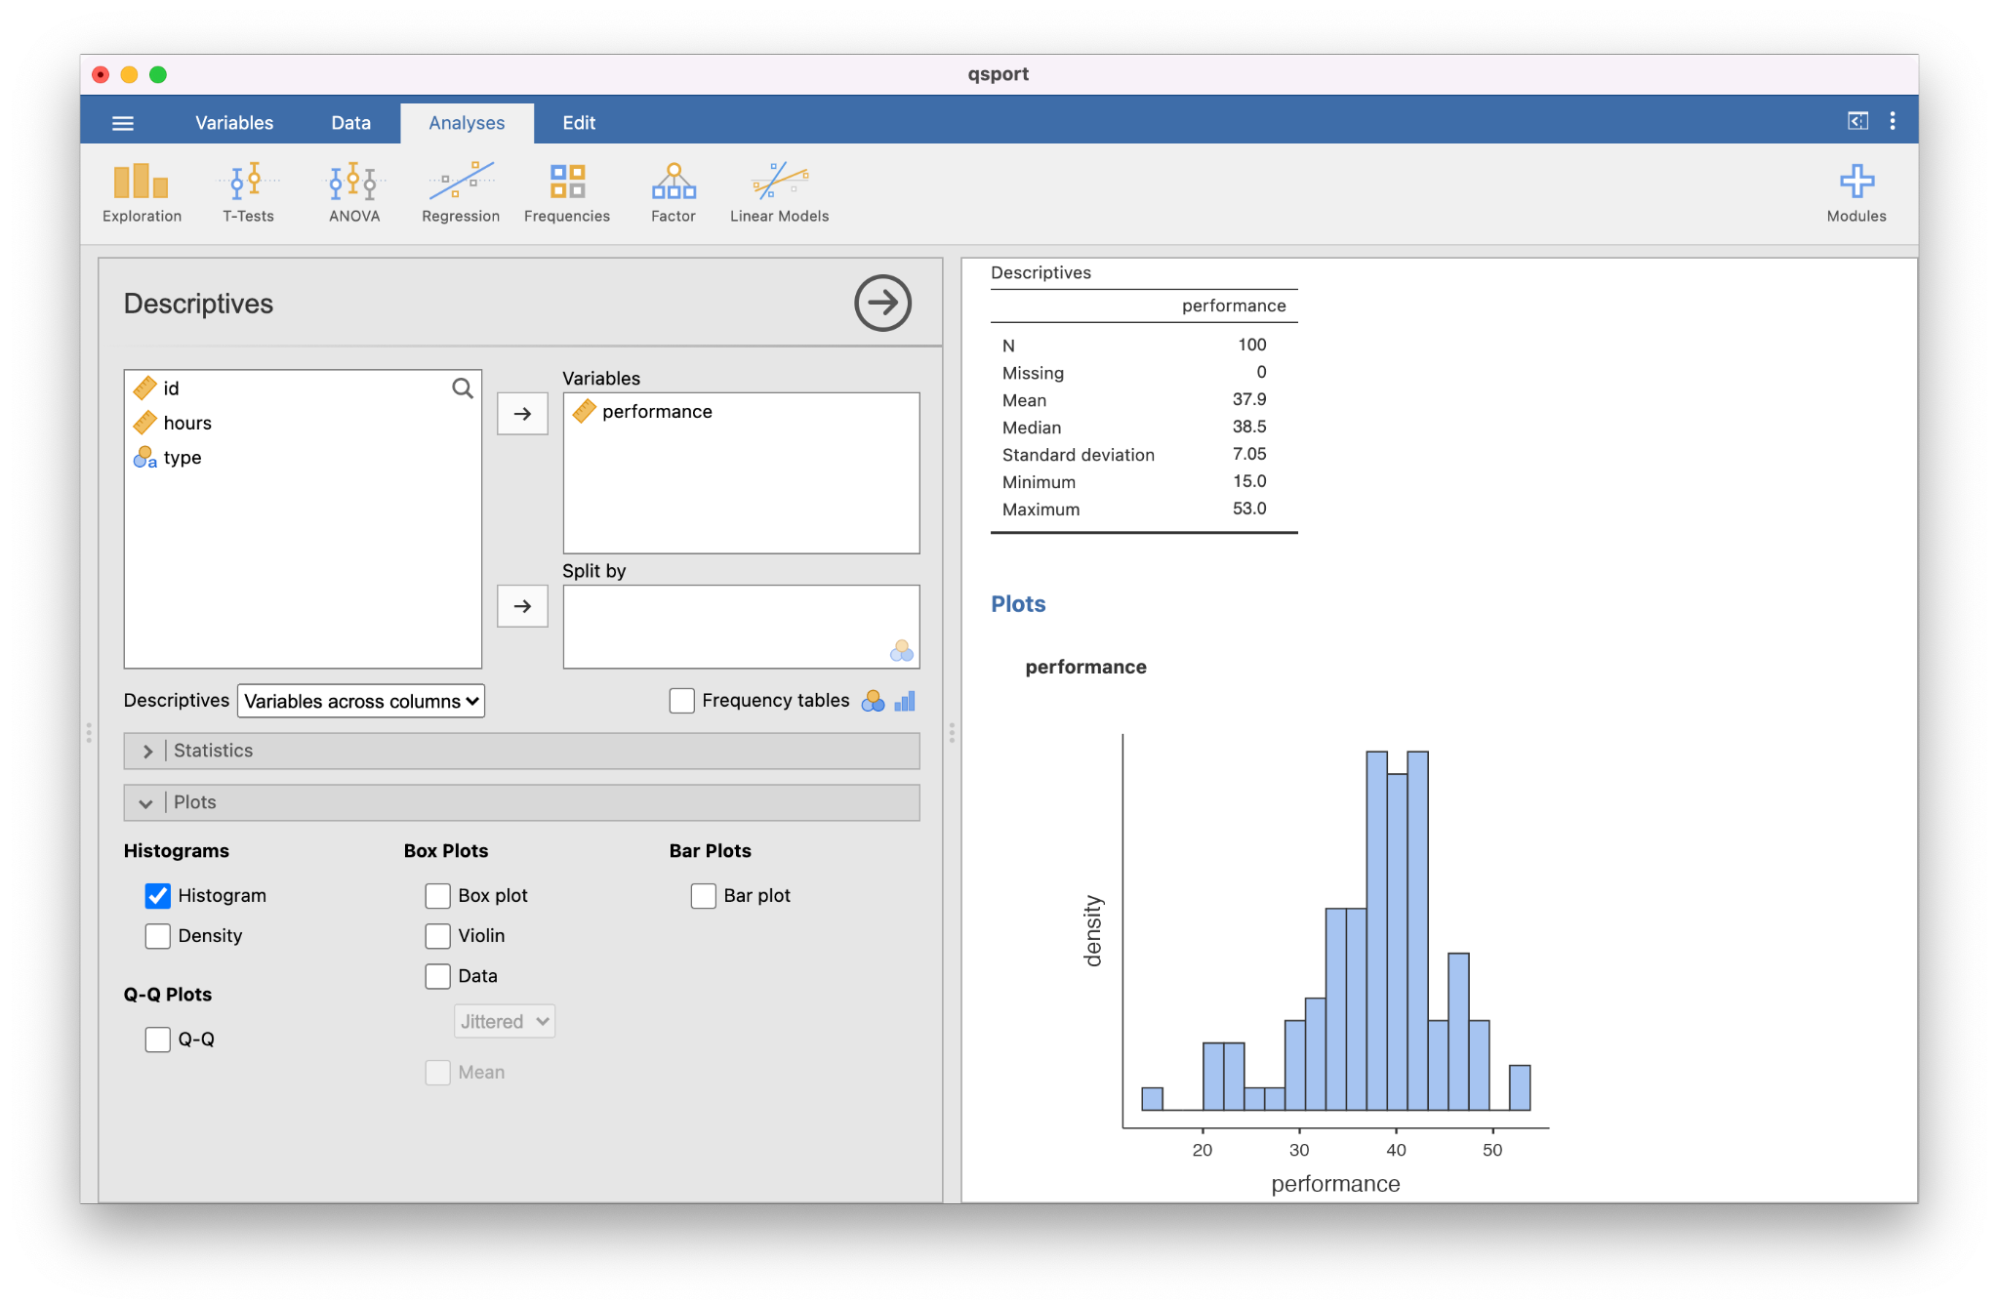
And then decide to make a histogram:
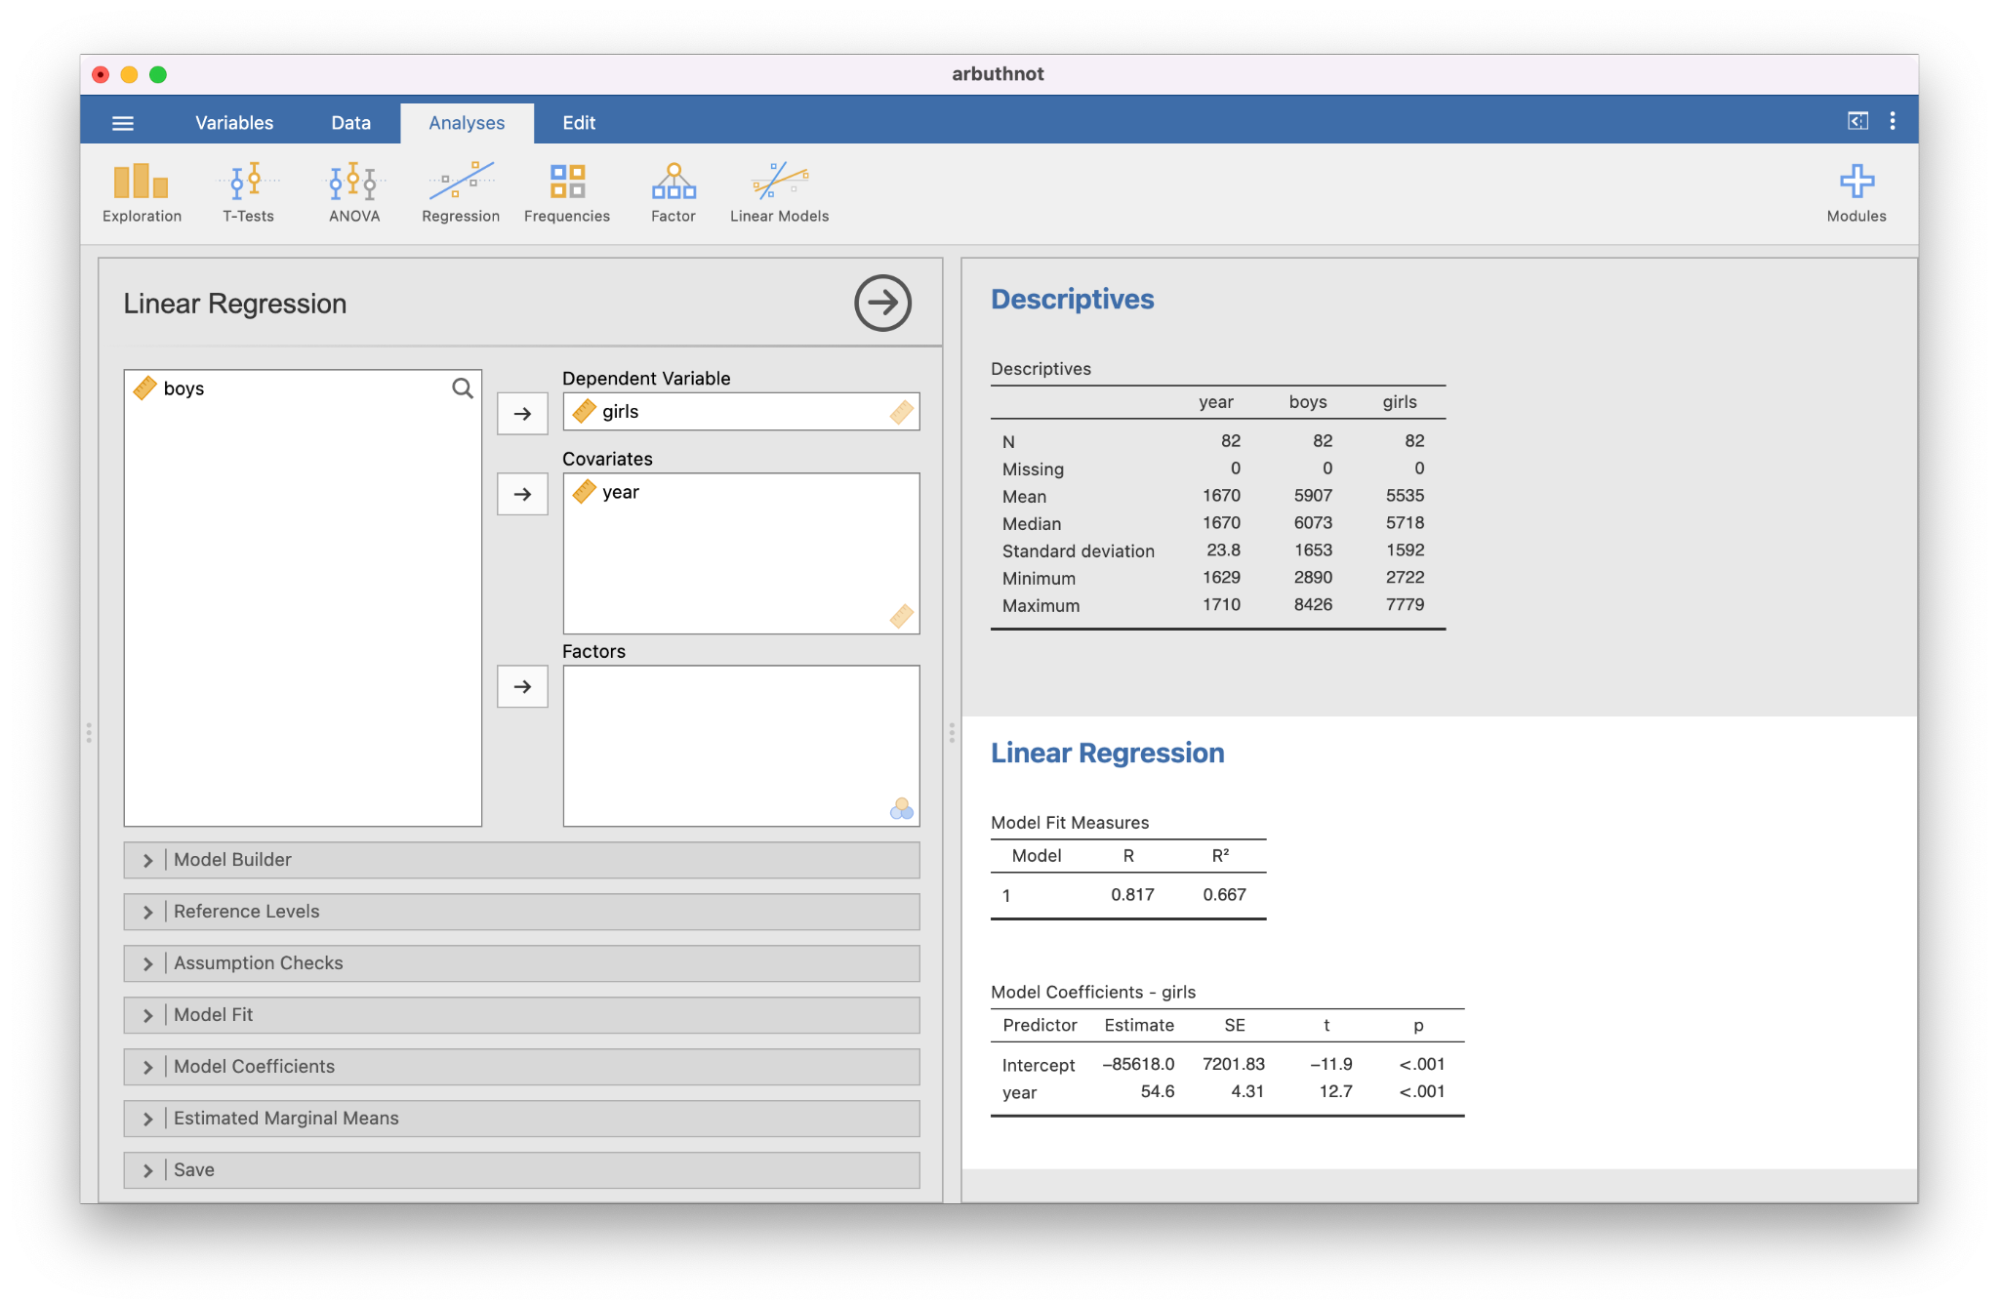
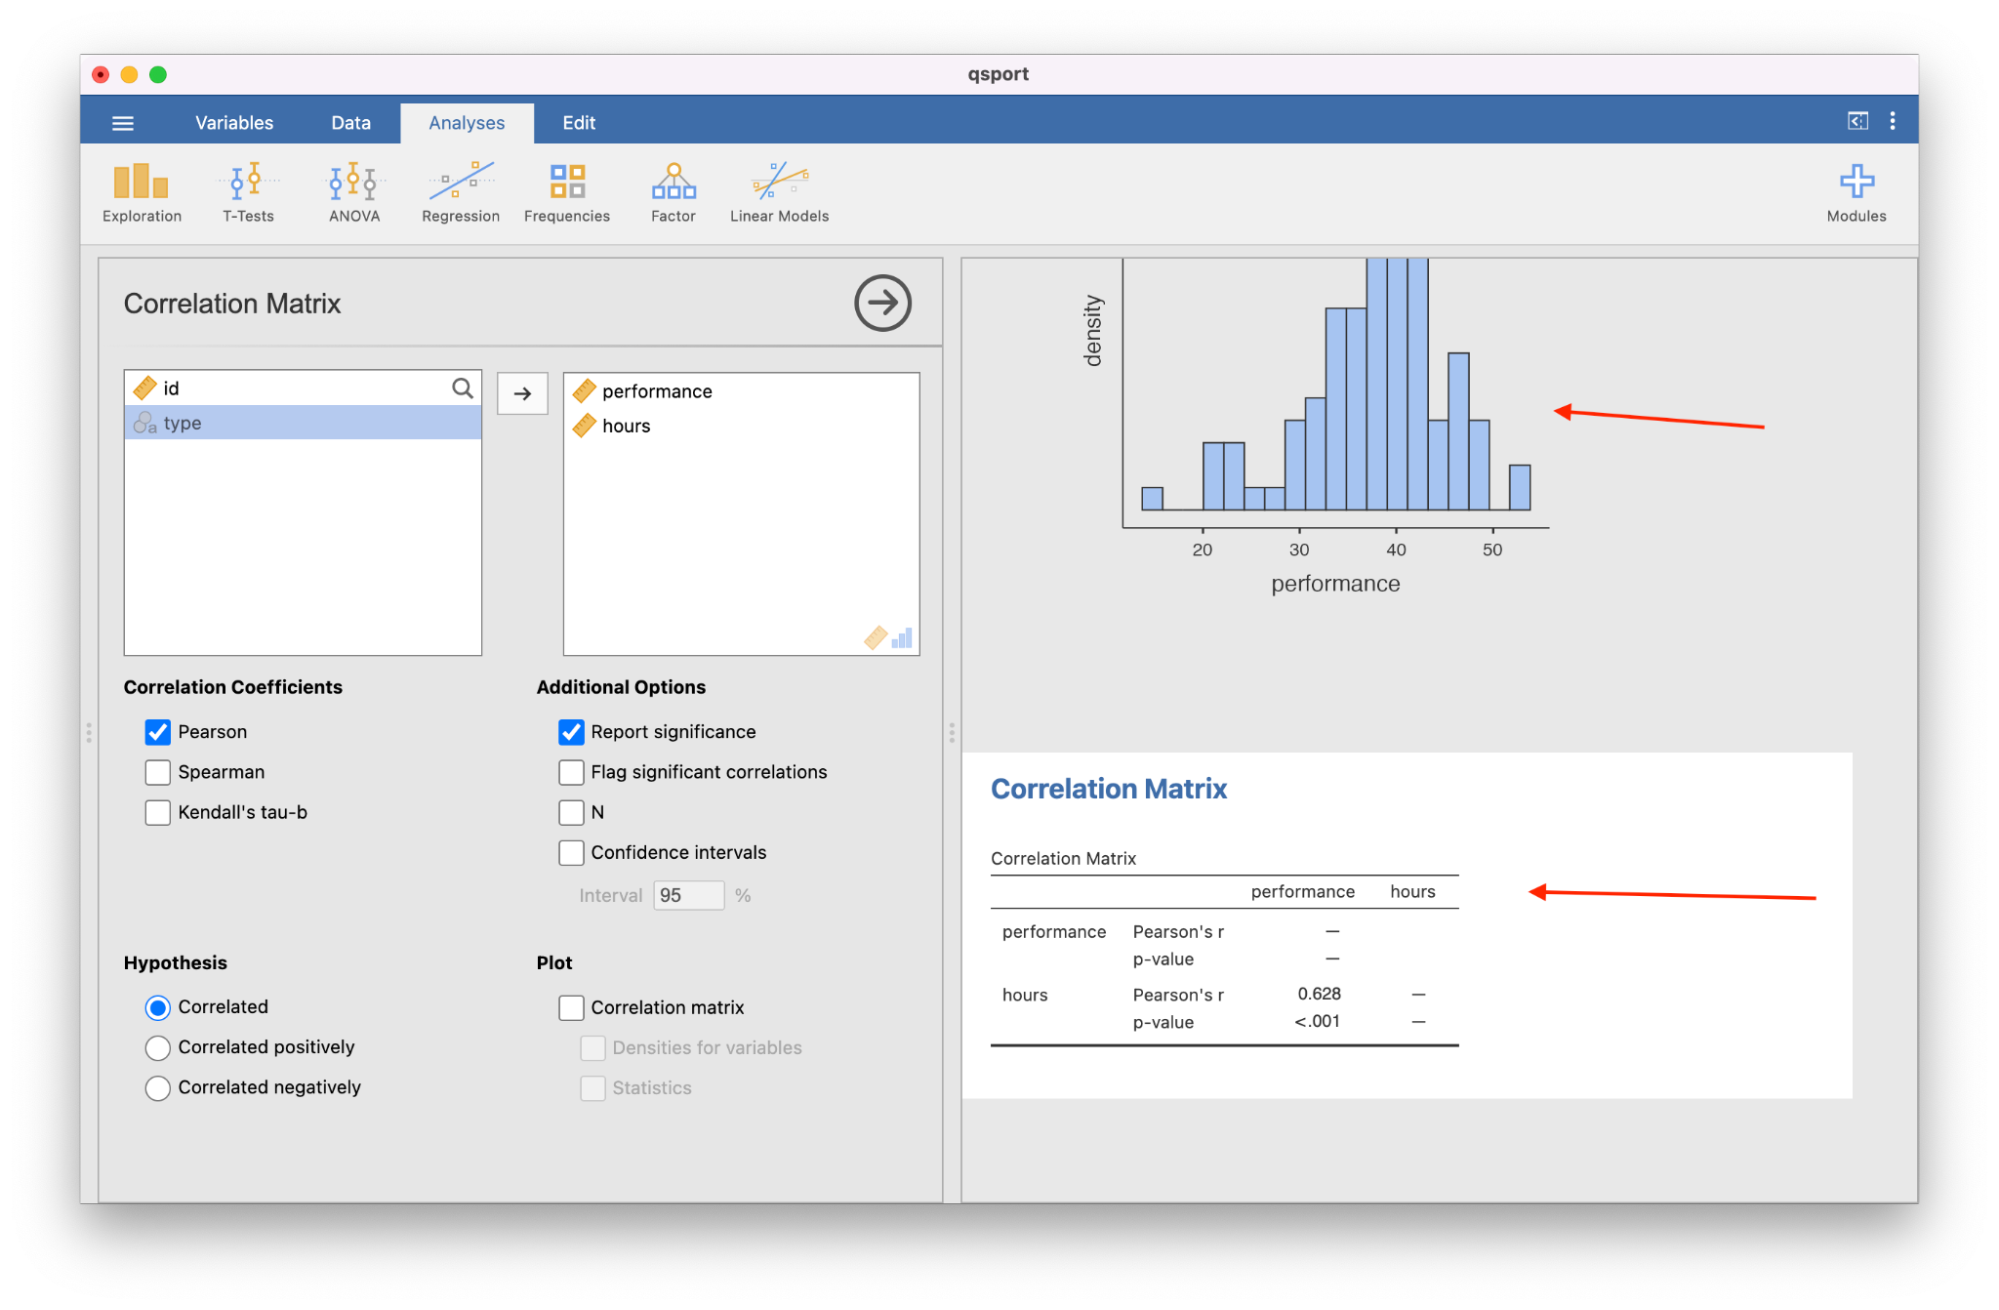
Then make a correlation matrix, which shows up below the histogram:
You might then realize that you made a histogram of the wrong variable. If you click on the histogram, the menu you used to create the histogram with all of the options selected will come back up:
You can then edit the histogram. Notes can also be typed directly into the right-hand side of the screen, and the analysis can be exported as a document. The file itself can also be saved in a native format which includes the data and all analyses, so you can see exactly what was done to obtain results. If you send this jamovi file to someone, they will have access to all this information - they'll see exactly what options you used to do every part of your analysis.
Further, the structure of the programs separate the data, the analysis options, and the results, which gives a benefit over using a tool like excel where results end up in the same sheet as the data itself, and results need to be written in a different program. The quick learning curve was advantageous to my classroom over a tool like R which required more effort and time to get comfortable with.
While both support writing ad-ins to extend their features, they are each also built on R, so you can access an R prompt from within the program and access the dataset. This made something like the hot hand lab, where a custom function was used, much easier to translate.
I'd encourage you to look through the labs to get a feel for what the analysis looks like. I found it to be an incredibly intuitive tool, and the students were able to get comfortable with it very quickly.
While jamovi and JASP have similarities, I'll go into a little detail here of why I ended up using jamovi during the semester. I liked both, and at the end of the day, I am sure I would have been fine using either.
Reasons to Use jamovi
One of the biggest motivations for me to use jamovi was that the data itself is directly editable from within the program. (JASP will instead open whatever default program your computer opens spreadsheets with.) The option to basically have an editable spreadsheet when fixing values without leaving the program was a nice feature.
Another reason this is beneficial is that one can start from a blank sheet, and generate data from a distribution to demonstrate. Four distributions are built in (and the binomial was the only one I really was missing).
Reasons to Use JASP
One thing that you might notice right off the bat if you download it is that JASP includes Bayesian versions of any test built-in. If you're interested in giving a flavor of Bayesian analysis in your class, it would be hard to beat this. (jamovi can too, but requires an add-on.)
The editor for equations in JASP is also quite intuitive. Where jamovi uses R-like syntax for filters (e.g. "=="), JASP has an editor which lets you drag-and-drop variable names and operations. This was almost enough for me to pick JASP for the class.
The differences were far less important than their similarities, so I'd recommend giving each a try to see how well they would suit your needs.